

What Is MFI Divergence in Swing Trading?
A plain-English definition of Money Flow Index (MFI) divergence for US stock swing trading: what a 14-day MFI divergence looks like, how I confirm it with a level break, and why judgement matters more than the indicator.
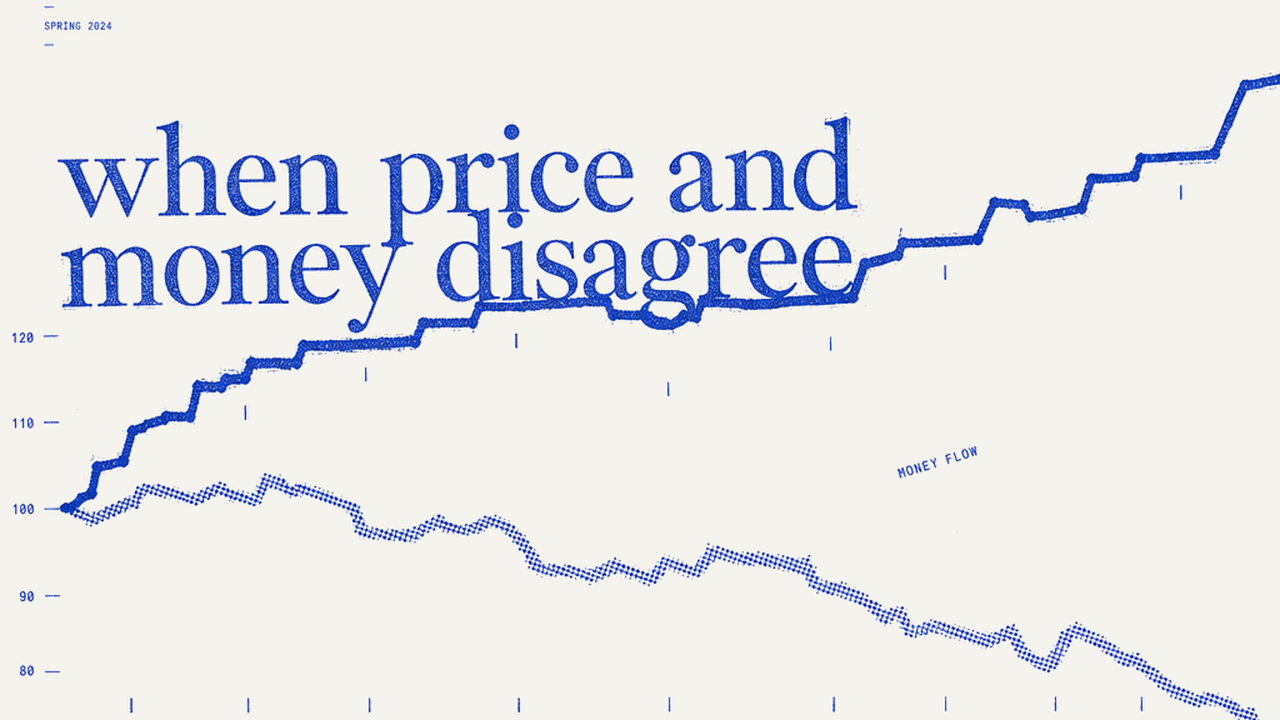
MFI divergence is when price makes a new extreme but the 14-day Money Flow Index does not confirm it. Price prints a higher high while MFI prints a lower high — that is a bearish divergence, and it means the rally is running on less money than the chart suggests. The mirror image, price making a lower low while MFI makes a higher low, is a bullish divergence: sellers are spending more effort for less result. In swing trading, divergence is a timing signal. It tells you when to pay attention. It does not tell you to click buy.
Key Takeaways
- MFI-14 measures money flow on volume, unlike RSI which reads price only.
- Bearish divergence: price higher high, MFI lower high — momentum is thinning.
- Bullish divergence: price lower low, MFI higher low — sellers are exhausting.
- I read it on the daily chart — 14-period MFI with Bollinger Bands — and wait for the level break.
- A divergence can run for weeks, so I stage entry and exit in three steps instead of going all-in on one signal.
- Divergence works best on liquid names and fails fastest in runaway trends.
- The tool reads the tape; my own read of news and sentiment is what usually gets me there first.
What is the Money Flow Index?
The Money Flow Index is an oscillator that runs from 0 to 100, calculated over a set period — 14 bars is the standard. Where RSI only looks at closing prices, MFI multiplies each period’s typical price by its volume, so a move on heavy volume moves the index far more than the same move on thin volume. That single difference is why I watch MFI instead of RSI: price can be talked about, but volume has to be paid for.
Readings above 80 are conventionally called overbought and below 20 oversold, but the raw levels matter less to me than the shape of the line against price. That shape is where divergence lives.
How to spot a bearish MFI divergence
The pattern takes three moves:
- Price rallies and pulls back — MFI rises with it.
- Price makes a higher high.
- MFI, on the second rally, makes a lower high.
The second push up happened on less money than the first. Someone still bought the top — but fewer of them, and with smaller tickets. I work on the daily chart, with a 14-period MFI and Bollinger Bands on the same screen, and I do not act on the divergence itself. I wait for the level break that confirms it.
How to spot a bullish MFI divergence
Flip the picture:
- Price sells off and bounces — MFI falls with it.
- Price makes a lower low.
- MFI makes a higher low.
Price went to a new low, but the money going out was less than on the first decline. The path of least resistance has usually already flipped upward, and divergence is often the first place the chart says so. This is the setup I find most useful at the end of broad sector pullbacks, when everything looks ugly on price alone.
When does MFI divergence fail?
This is the section that matters, because divergence fails often — and it fails in a specific way: it fires early, then fires again, and again. In a strong uptrend you can see two, three bearish divergences in a row while the stock keeps climbing. The divergence is telling you the trend is getting thinner, not that it has ended. Trends can stay thin for a long time.
So my rule: a divergence is a reason to move a name onto the watchlist, not a reason to trade it. A divergence on its own can be a signal, but it can also last longer than I expect, and holding the trigger too early is how I end up acting at the wrong time. Ideally I want the price level broken before I act — that break is the second event. And I do not go all-in on a single signal: I spread entry and exit across three stages. Running it that way takes a margin account, options trading skill, and enough risk-management discipline to size each tranche before the first one goes in.
The part the indicator cannot do
Something matters more here than the indicator itself: the ability to sense momentum forming out of market news and sentiment. A divergence is a chart record of a turn the market has already started to make. News and sentiment let me anticipate that turn instead of only learning about it once the figures have confirmed it. That is why I treat analytic tools as tools. They do the work they are good at — reading money flow, ranking a watchlist, keeping every name measured the same way — but on their own they describe what is happening rather than warn me about what is coming. Good personal judgement is a key element to staying in this business.
It is also worth keeping the tools in proportion. Analytic tools only become weapons that decide the trade in sub-minute quant work, where the edge has to be measured in seconds. That is not a game most retail traders are playing, and it is not a game a swing trader is playing. On a days-to-weeks horizon the edge is not in speed, so it is in the read, the sizing, and the patience to wait for the level break instead of chasing the line.
How I use it in practice
I run MFI-14 across the watchlist through quantorb, which computes it the same way for every name — so the comparison is like-for-like. What I am scanning for is not a magic number but a mismatch between what price did and what money did. When the two disagree, one of them is wrong, and volume is usually the honest one. The scan tells me where to look; what I read in the news, and how the tape behaves as the turn develops, decides whether the name is worth a position.
Questions traders ask about MFI divergence
What timeframe is best for MFI divergence?
The daily chart. I run the daily with a 14-period MFI and Bollinger Bands, and I wait for the level break before I act on a divergence. Divergences on intraday charts fire too often to be useful, and on weekly charts they fire too rarely to time an entry. The daily is where signal and frequency meet.
Is MFI better than RSI for divergence?
They show different things. RSI divergence is a statement about price momentum; MFI divergence is a statement about price momentum with money behind it. In my experience the MFI version filters out the hollow moves RSI will still flag. Neither is better in the abstract — MFI is better for the question swing traders ask, which is whether a move is funded.
Can I use MFI divergence without watching volume?
No — and that is the point. Volume is the input that makes MFI what it is. Stripping it out gives you RSI with extra steps.
Is a confirmed divergence enough to trade on its own?
No. Once the level breaks, the setup is confirmed — but I still stage entry and exit across three stages rather than commit the full position, because a confirmed divergence can still be wrong about timing. I also weigh what the news and sentiment are saying around the name. The chart confirms the turn; the judgement decides the size.
Educational notes on my own process, not investment advice. Trading involves risk of loss.
